-
Share on Facebook
-
Share on Twitter
-
Share on LinkedIn
-
Copy link
Copied to clipboard
CME futures and CFTC data: BTC and ETH
As we write this, crypto markets find themselves in something of an awkward spot, and we would be lying if we expressed any strong degree of certainty over what plays out over approximately the next two weeks or so. ETF flows, which had still been in the aggregate strong over the first few weeks of the products’ existence, picked back up somewhat early this week (with a roughly $500m day on Monday).

As we write this, crypto markets find themselves in something of an awkward spot, and we would be lying if we expressed any strong degree of certainty over what plays out over approximately the next two weeks or so. ETF flows, which had still been in the aggregate strong over the first few weeks of the products’ existence, picked back up somewhat early this week (with a roughly $500m day on Monday).
Our tendency is to think that the flows and associated demand themselves aren’t the first catalyst on price still, and that this has more to do with risk-on appetite in US markets in general (S&P breaking 5000 on Friday, BTC breaking above normal retest levels at exactly the same time), but a substantial break on the pre-ETF highs serves as a psychologically and technically important mark for BTC, and early action on Wednesday suggests that there is a possibility that crypto markets could end up taking on a life of their own, especially in the period between today and the end of February (options traders are loading up on call strikes in the 60k+ range for a reason – doubtful that any such calls close in profit but it’s very conceivable that such marks will end up flipped in the run-up close to ITM).
Momentum in crypto markets always has the possibility of causing chaos. Instead of trying too hard to make sense of said chaos, this seems like an opportune moment to take a step back and look at a couple of longer-range metrics that we have used in the past to make sense of the character of the market, and hence where we are in terms of the cyclical nature of crypto markets as a whole at any given point.
Specifically, we will take a look here at CME futures and options data. The CME BTC futures have had something of an interesting history; being, as they are, extremely large lot sizes (the main contract trades in 5-BTC lots, and even the supplementary Micro Bitcoin contract launched in 2021 trades in 0.1-BTC lots), and part of a fully regulated venue, these for a time served as the leading way for a particular class of money (family offices, larger hedge funds, etc.) to get exposure to BTC given the mistrust in even the onshore exchanges and custodians at this point. From 2019 to 2021, there was a clear ebb and flow that line up with what that sort of investor was doing: an uptick going into 2020 that was wiped out by the COVID market crash, long positioning into the halving, more long positioning during DeFi summer, and then a final surge in Q4 (just prior to markets breaking $13k and starting to move parabolically) before dropping off as momentum faltered in January.
The landscape now is a little different. To see this, we need to show positions as broken down between the CFTC’s classes of market participant. The first is dealers, which were nearly non-existent until 2022, at which point they have been persistently and endemically short (this of course is not an expression of positional bias, but reflects the degree to which said futures have been used for hedging).
The second is asset managers. Also historically a very small portion, these overnight became a significant amount of OI (almost entirely long) in November 2021 and have slowly grown their chunk of the pie since. The third is leveraged money; this has always been a very vague definition under CFTC rules (in the same way that the term “hedge fund” itself ultimately is),and skews endemically short, but has tended to be a somewhat useful touchpoint for understanding what the aforementioned middle strata of money (between the largest institutions and retail or as-good-as) is thinking at a particular point. The other two making up the balance are other reportables and non-reportables.
Putting this data onto one chart since the inception of contract reporting (there is a minimum needed OI for this and the main CME contracts did not reach this until April 2018) is, as you’d expect, messy:
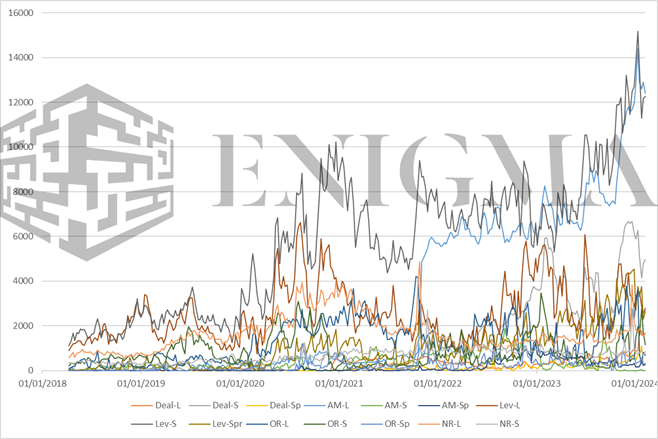
While liquidity and volumes have improved somewhat on further-dated contracts (e.g. at the time of writing, March 2024 contracts have around 8000 OI against 15000 OI for February’s; even this close to expiry, next month’s contract would have been an order of magnitude lower than the current one a year or two ago), almost all business is still done on the closest contract, hence the added noise in data that is already usually noisy.
However, we include it anyway because there are two things that jump out even through that noise. The first is the asset management long positions jumping from nowhere to consistently the second-highest category over the last two years. The second is the ramping up of leveraged funds into short positions.
Zooming in a bit gives us this:
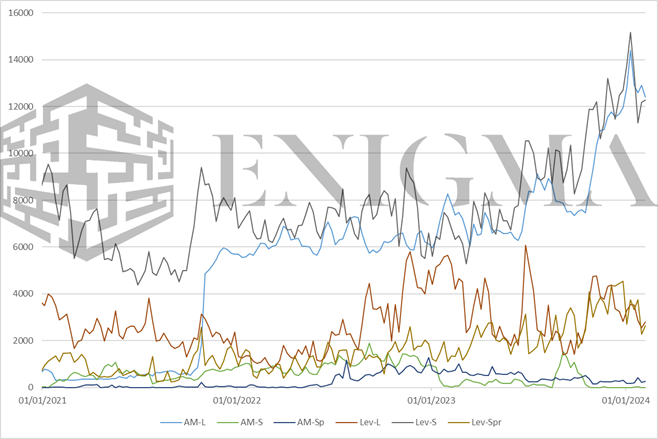
Our experience since the inception of the CME products is that, of all the categories, the one that tends to be most interesting and useful to take at face value re: representing some group’s positional viewpoint is the leveraged funds category. If we look at historical jumps in shorts of the sort of velocity we saw in November through January, we see a few standouts: the three fakeouts in 2020 mentioned earlier, November 2020, September through December 2021, and May through early July of 2023.
Of course, the category also makes up a large share of long OI, and the ratio of shorts to longs in the category is of interest:
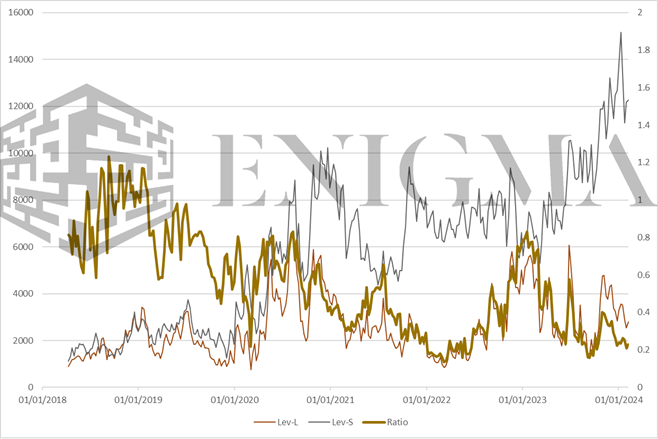
Unlike most of the previous spikes (except March 2020), this is also among the largest short skew that the category has ever seen; the only comparable points are mostly clustered in Q1 2022. There is an argument to be made that the velocity here has some similarities to Q4 2019/Q1 2020, but we tend to think the case there is relatively weak.
This is both surprising and unsurprising. It is unsurprising because, as we have said time and time again, our entire view on the market at the moment is coloured by an enduring view reflected through many lenses that retail participation remains extremely low in spite of prices that are, historically-speaking, a couple of good weeks away from all-time highs; an outsized spike in funds that historically speaking consider themselves the ‘smart money’ and sector-agnostic also hints towards that. It is surprising because, even if we assume that the long-term trend is towards shorter positioning for more complex market structure-related reasons (note that in the very early days of the product, the ratio was consistently close to or even above 1), we would not expect the ratio to be that low, especially in the lead-up to the ETF (where prevailing wisdom leaned towards short-term flows being more aggressive than even those seen, which themselves were surprisingly positive in historical context).
A side-note here: unlike when this CME/CFTC data was a more regular fixture of this weekly in 2020 and 2021, we now have micro-BTC futures and Ethereum futures (both regular and micro). We have not included the micro-BTC numbers on the graphs here because they are, by definition, a tiny amount of open OI; as of the last report, the 17313 contracts open equated to 1731.3 BTC, against 22776 and 113,880 BTC on the main contract. The one thing we will note in relation to that is that we have seen some reporting talking about a wipeout in OI at the end of last month (from 26,850 contracts to 13,274) on BTC CME futures; this was specifically on the micro contract, and the main contract saw little appreciable drop (25,013 to 22,479). The micro contract may warrant closer monitoring in the future given that it should naturally be adjacent to smaller players but we currently see it as too similar to the very old numbers on the main contract, where one or two participants might make up such an overwhelming portion of a given section’s total that it’s hard to read much into weekly or monthly variations.
The dynamic is the same on the Ethereum contracts, but we will make a note here of OI on said contracts over time compared to BTC OI from its inception, converted to USD:
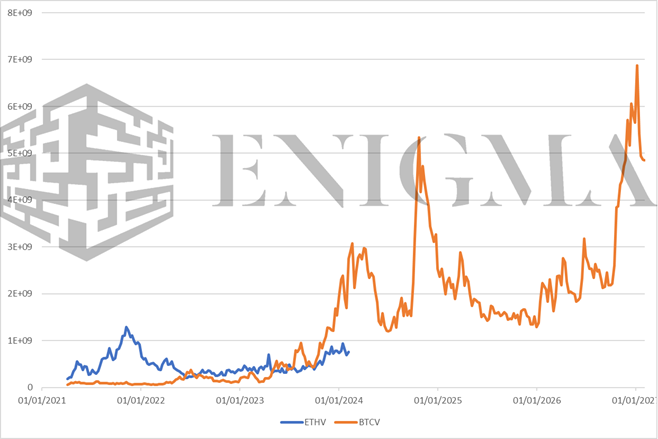
The general cyclical nature of the market makes this an imperfect comparison (i.e. USD-OI is driven by underlying price more than anything else), but the relevant note here is that ETH OI has increased only very modestly over the past three years; this further reinforces our general thesis on ETH, which is that it has very, very little mindshare relative to its size and valuation even among more sophisticated market participants all the way up and down the ladder. This matters mostly in terms of the ETH ETF coming out in a few months and in terms of relative valuation within the market for it vs BTC. The jump on BTC OI (and then price as a slight laggard of that) at around the same time was at least reflective of BTC establishing itself as an asset for the long-term; it will be interesting to see if we end up seeing something similar as an indication of the status of ETH as an asset in coming months.
