-
Share on Facebook
-
Share on Twitter
-
Share on LinkedIn
-
Copy link
Copied to clipboard
On BTC and crypto drawdowns
To give a brief view of the ‘why’ here insofar as anyone has a strong indication: we tend to think a lot of it has to do with weakness on ETH as a market leader (the expected hangover after the Dencun upgrade’s implementation, murmurs around the ETH ETFs being rejected or delayed – we think rejection is unlikely but a delay beyond the first deadlines in May is possible) and on BTC ETF buys/flows being somewhat more sensitive to outside conditions than some quarters were beginning to assume. Renewed focus on the FTX case as Sam Bankman-Fried approaches sentencing (on March 28th) may also be dampening retail appetites somewhat. The long and short of it is that we think there’s a decent chance that the current drawdown ends up deepening somewhat (albeit we have tended to underestimate market resilience over the last 3-6 months) and that prices end up much, much higher by year’s end.

If crypto markets were equities, we would be tinkering on the brink of a technical bear market right now. Of course, if my auntie had wheels, she’d be a car, so perhaps not the most useful of comparisons overall, but anyway. After a couple of months of unbridled gains, markets have finally cooled a little over the last few days, with BTC and most of the broader market deeply in the red after selloffs towards the end of last week and again on Tuesday.
To give a brief view of the ‘why’ here insofar as anyone has a strong indication: we tend to think a lot of it has to do with weakness on ETH as a market leader (the expected hangover after the Dencun upgrade’s implementation, murmurs around the ETH ETFs being rejected or delayed – we think rejection is unlikely but a delay beyond the first deadlines in May is possible) and on BTC ETF buys/flows being somewhat more sensitive to outside conditions than some quarters were beginning to assume. Renewed focus on the FTX case as Sam Bankman-Fried approaches sentencing (on March 28th) may also be dampening retail appetites somewhat. The long and short of it is that we think there’s a decent chance that the current drawdown ends up deepening somewhat (albeit we have tended to underestimate market resilience over the last 3-6 months) and that prices end up much, much higher by year’s end.
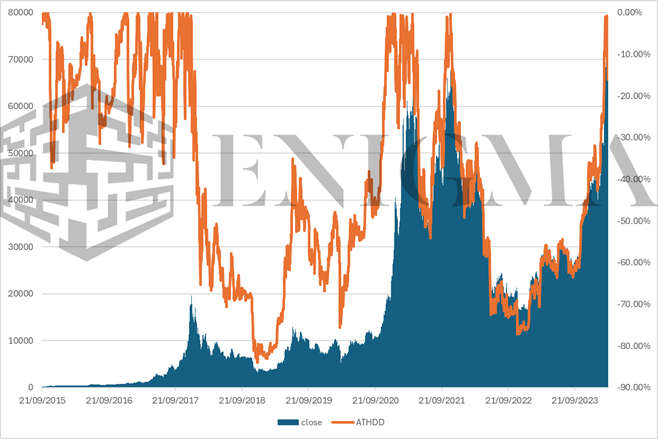
However, in the shorter term…it seems apropos to talk about drawdowns historically in crypto markets, particularly on BTC and ETH, and specifically how they’ve tended to play out over the last few cycles practically speaking. To start with, we can look at drawdown from all-time high over time since 2015 (per Coinbase data). That chart looks like this:

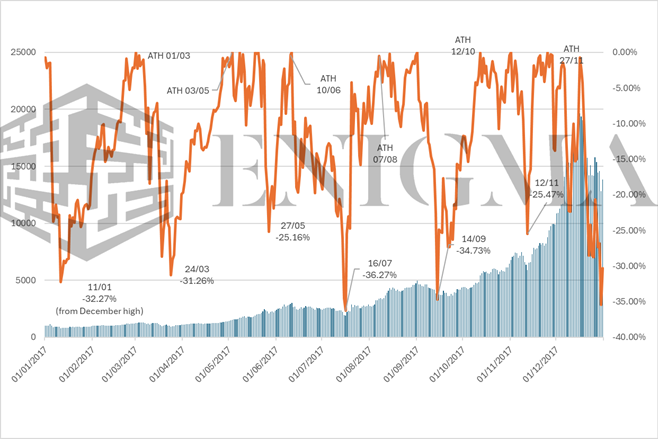
This graph, of course, gives us something of an odd view, especially given that everything after the late 2021 peak essentially just maps to price anyway (even allowing for us having put in a slightly higher high in the last month), and that it doesn’t include data from before 2015. However, even allowing for that first ‘true’ ATH being gone, you may note a clustering of ATH hits and subsequent drawdowns in 2017, which we can zoom in on:

The 2017 PA here is important to understand, both for its own sake and for how it tends to weigh on the thinking of market participants to this day. As BTC started to move upwards in 2017, we would see repeated significant drawdowns – one from the local high at the start of 2017, and then five more times of -25% or more (at daily close), each time followed by the first new ATHs being set between 30 and 60 days later. This was the pattern for a year in which price ended up 20 times higher on BTC than it started – significant drawdowns over and over in what was otherwise an unabated up trend.
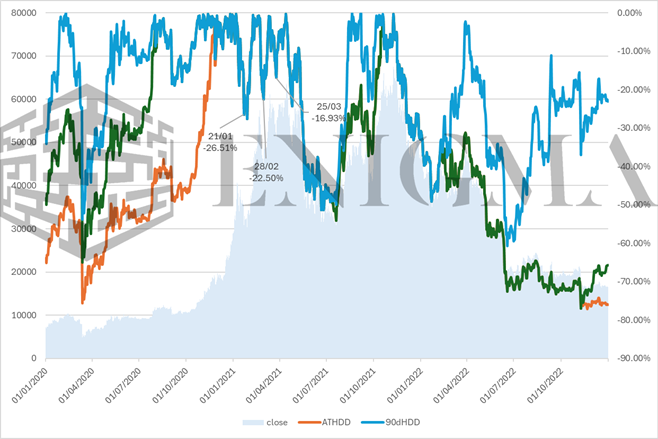
2020-22, as it turned out, would end up a little different:

The double top thanks to the autumn 2021 recovery complicates things here a little, as does action in and out of the Covid crash in March 2020; however, what we end up seeing is fairly consistent growth with few drawdowns throughout 2020 post-crash, the ATH break in the autumn, a few of those characteristic drawdowns at the initial top in 2021 (albeit only one that passed that -25% mark from before), and then straight up and straight down again in autumn/winter 2021 (which, again, we now know was an extremely abnormal environment because of the presence and activity of Alameda and connected entities).
We have been consistently surprised at how few drawdowns there have been on BTC – at least, of any significant magnitude – over the last few months. September’s dip peaked at -21% on a 90-day timeframe, while the post-ETF slump topped out at -19% on January 22nd (against 30d/60d/90d highs); yesterday’s close at $61.9k still only put us at -16%.
The million-dollar question, as such, is whether this cycle is potentially going to play out in a very similar way – that being, that drawdowns during the overall uptrend will remain extremely modest (and relatively short-lived). There are a couple of things to consider here. Firstly, we still think that the assumption that near-term ETF flows are price-insensitive and essentially programmatic is not particularly accurate; on the inflow side, numbers dropped off just as quickly as they surged last week when prices started to drop, and GBTC outflows were near record lows last week before stepping up this week. The fact that volumes have been so significant as a proportion of AUM relative to similar classes of ETFs stands as another nod towards that.
Another thing that we will note here is that we did also run the numbers for ETH drawdowns to see how they compared – the thought being that it may genuinely be a feature of size for BTC with respects to not seeing those drawdowns anymore. We have not included those graphs here for the very simple reason that they are ultimately very, very similar to BTC – one drawdown barely cresting -30% in that early 2021 run (against -23% on BTC at the same point), but for the most part telling the same story of reduced propensity in 2020 compared to 2017.
Hence, our best estimation would be that the 2021 price action will prove to be at least somewhat aberrant, and with that in mind, odds weigh favourably towards an extension of this week’s drawdown over the course of the next couple of weeks, possibly to a retest of the breakout point from back in February all the way at $51k (albeit any such test is likely to be brief). However, as has been the case for a couple of months now, medium-term outlook remains bullish; extended drawdowns should mostly be seen as opportunities to increase exposure rather than concerns to be actively avoided, and we tend to expect flows from larger market participants in particular to end up reflecting that (i.e. another wave of buying starting in early April would be entirely unsurprising).


